Using Visualea : Beginning#
Here is a tutorial in which you will see how to implement a simple modeling problem in Visualea
Here is what you need for the following tutorial
conda create -n visualea_tuto -c openalea openalea.visualea openalea.components openalea.plantgl boost=1.66 -c openalea/label/unstable
conda activate visualea_tuto
Once you installed and activated the OpenAlea environment (see Installation), execute this
visualea
The Goal#
We measured some tree data and saved these in a tabbed editor (like Excel). The data has been exported in a CSV file. We want to have a simple 3D representation of the measured tree.
Here is the data :
X |
Y |
crown_up |
crown_bot |
trunk_diameter |
|---|---|---|---|---|
0 |
0 |
10 |
20 |
2 |
10 |
12 |
12 |
18 |
3 |
20 |
22 |
8 |
23 |
3.4 |
0 |
18 |
14 |
22 |
2.5 |
You may want to download the CSV file.
Step 1 : Create Your Own Package#
First of all, we need to create a package where to put your work (dataflow, node definition, data, …). A package is in fact a simple directory containing python files.
Create a package#
Select Package Manager -> Add -> Package
Fill the form :
Name : standbuilder
Description : build stand representation from measured data
Version : 0.1
License : Cecill-C
Authors : All collaborators and package writer
Institutes : …
URL : …
Path : /home/myhome/openalea_pkg (could be anywhere you want)
Click “OK”
Your new package should appear in the package manager.
Tip
The path corresponds to the directory where the python file will be written. Choose it carefully in order to be able to find it later.
Step 2 : Read CSV Data#
Create a dataflow to read and view a file#
Tip
Leaving the cursor on any item in the Package Manager, or on nodes or ports in the dataflow view brings up a tooltip. Clicking on them also shows some documentation in the “Help” tab (bottom-left-hand corner).
In the Package Manager tab (left column), open the openalea.file folder. You should see a list of nodes.
Note
You can search for a particuliar node in the Search tab.
In the Package Manager tab, drag the
readnode from the openalea.file package to the workspace. It should now appear on the canvas.In the workspace, right click on the
readnode and choose “Open Widget”. Then browse for the “stand.csv” file (no need to validate anything, changes are automatically taken into account so you can simply close the window).In the package manager search the
textin the search tab, then drag thetextnode from the openalea.data structure.string folder onto the workspace.Connect the output of the
readnode to the input of thetextnode.
View the file contents#
Right click on the
textnode and select “Run”Right click on the
textnode and select “Open Widget”
Build a CSV object#
In order to manipulate the CSV data, we are going to build a CSV object.
Select the search tab in the package manager
Type CSV
Drag the
read csvnode on the workspaceDo the same to create a
getitemnode (openalea.python method.getitem)Connect
read’s output toread csv’s inputConnect
read csv’s first output togetitem’s first inputAdd an
intnode on the workspace, and connect its output to the second input ofgetitemExecute the graph by selecting “Run” in the context menu of the
getitemnodePrint the output in the shell : Right click on the output port, and select “Print”
Save your work#
Select File -> Save as composite node (CTRL + S)
In the selector dialog, click “New” Button
In the new dialog
Select the standbuilder package in the combo box
Enter the name : readcsv_1
Add a description : Read data file
Click “Ok”
In the selector, click “Ok” button
The new graph should appear in the standbuilder package.
Step 3 : Create a simple 3D representation of one tree#
Before displaying the whole stand, we must rebuild a tree. In this tutorial we build a very simple tree representation composed by a sphere for the crown and a cylinder for the trunk.
Create a 3D object#
This simple dataflow shows how to display a scene object.
First step, we create a new workspace : Select File -> New Empty Workspace (CTRL+T)
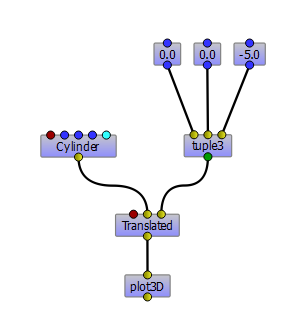
Create the following dataflow by using PlantGL nodes
plantgl.objects.cylindercreates a cylinderplantgl.objects.translatedmoves the input objectopenalea.data structure.tuple.tuple3to set the translation vectorplantgl.visualization.plot3dto view the resultopenalea.data structure.floatto set the parameters of the tuple3 node
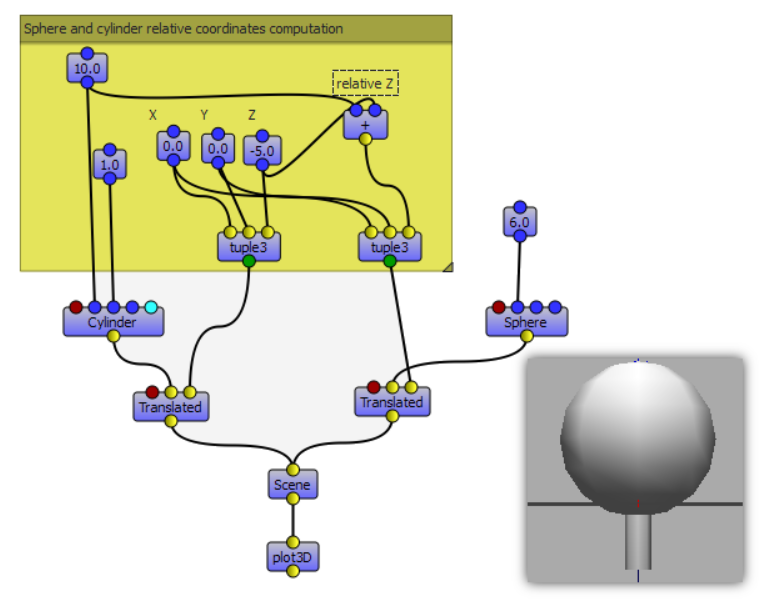
Create a simple tree#
To build our tree, we must construct a PlantGL scene containing a cylinder and a sphere.
Modify the previous dataflow as follow:
Add a
plantgl.objects.sphereobjectAdd a
plantgl.objects.translatedobjectAdd a
plantgl.objects.sceneobjectConnect the 2 translated objects to a
plantgl.objects.sceneobject
Save this dataflow in your standbuilder package as simple_tree
Step 4 : Create a Macro Node / Group Nodes#
We will need to use the previous dataflow to build trees. To simplify this procedure, we would like to use a simple node and not a complex dataflow. For that we are going to embed the previous dataflow in a composite node (also named macro node).
Transform simple_tree to a reusable composite node#
Select simple_tree in the package manager
Right click on the simple_tree graph, select “Properties” and click on the “Inputs / Outputs” button
Add 5 inputs with the + button :
X - IInt - 0 - X position
Y - IInt - 0 - Y position
crown_up - IFloat - 16.0 - Top of the crown
crown_bot - IFloat - 8.0 - Bottom of the crown
trunk_dia - IFloat - 3.0 - Trunk diameter
Add 1 output with the + button
scene - None - PlanGL scene
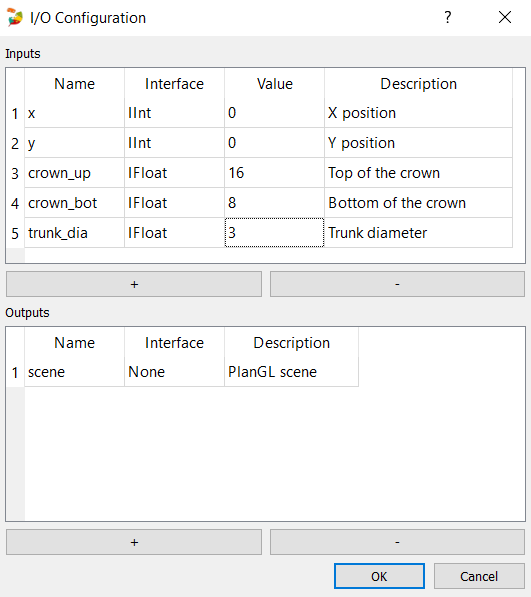
Click “OK” and the buttons will appear in the workspace
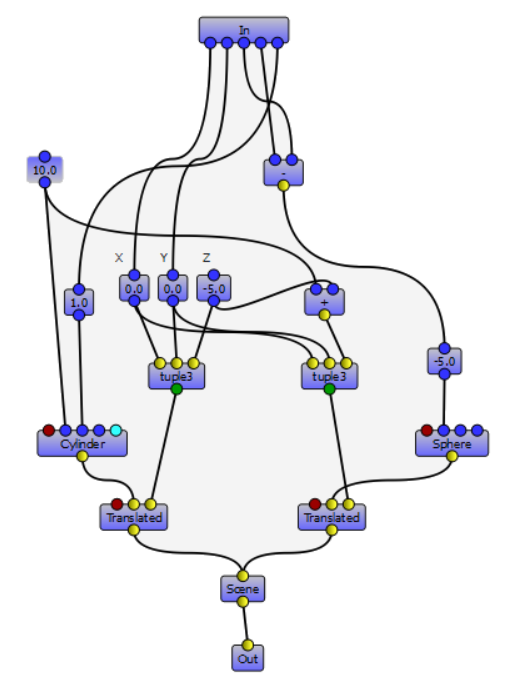
Double click simple_tree and modify the graph as follow
Connect input 0 and 1 to the X and Y nodes
Connect input 2 and 3 to a minus node
openalea.math.-, and connect the result to the crown radiusConnect input 5 to the trunk radius
Connect input 3 to the crown bottom
Save your work as a new composite node in standbuilder named tree_scene
Using the new composite node in a dataflow#
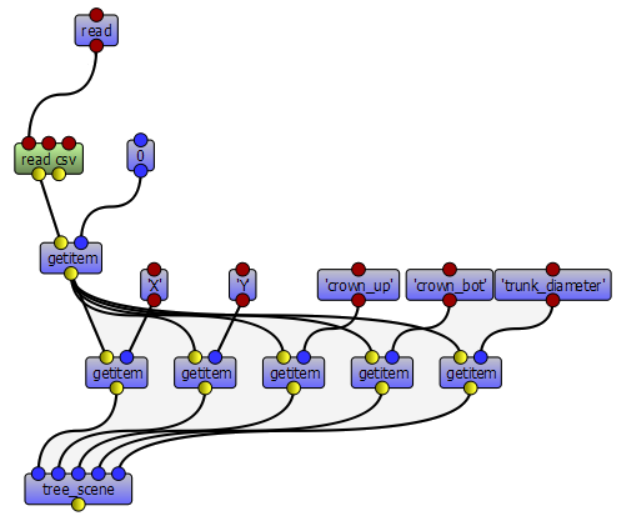
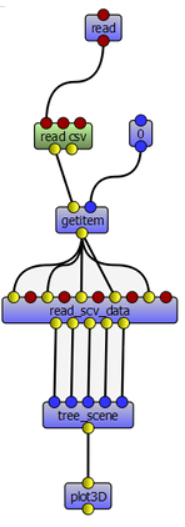
Open our first dataflow readcsv_1 in the standbuilder package (doubleclick)
Drag the node
standbuilder.tree_sceneon the new workspaceAdd 5x
getitemand 5xstringobjectConnect the nodes as the picture in order to retrieve to different object properties
Add a
plangl.visualization.plot3Dobject and connect it to the output oftree_sceneRun the dataflow several times and change the value of the first
getitem(object index)Save the dataflow in the standbuilder package as readcsv_2
Create a composite node by grouping nodes#
Select the 5
getitemand their associatedstringobjectClick on Menu Workspace -> group (CTRL+G)
Run the dataflow
Save it in the standbuilder package as readcsv_3
Step 5 : Get the spatial distribution of the trees#
We want to extract from the csv object the X and Y properties and plot them in 2D.
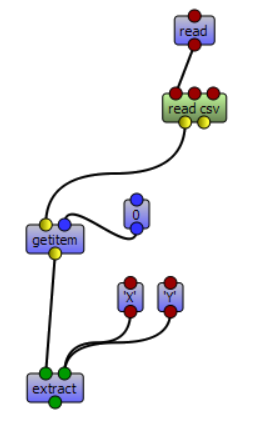
Extract data#
Create a new workspace (CTRL+T)
Add a
readnode and aread csvnode to read a csv fileSet the file to read by opening the
readwidget (Open Widget)Run and display the output (output port context menu -> Print or Tooltip) : it’s a list of obj
Add a
getitemnode and anintnode to select an object in the listAdd an
extractnode and 2stringnodes to select properties in a particular objectSet the 2
stringobjects to X and YRun and display the output (output port context menu -> print or tooltip) : it’s a list containing the X and the Y properties of the selected object.
Implement iterative process#
We want to do the same thing, but for all the CSV objects contained in the file.
Remove the
getitemand theintnodes (with suppr)Add an
openalea.function operator.mapConnect the output of
extractto the first input ofmapConnect the output of
read csvto the second input ofmapAdd an
openalea.flow control.Xnode and connect its output the first input ofextractRun the
mapobject and display the result
Note
The X object represents a function variable. The map apply a function to each element received in its second input.
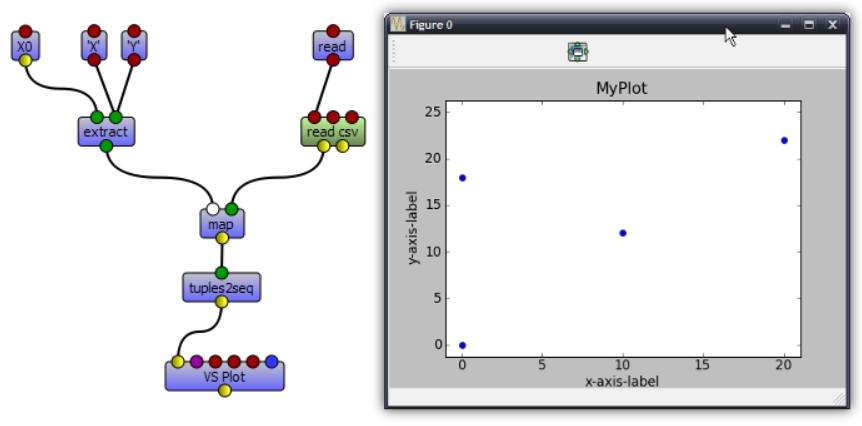
Plot 2D#
Add the nodes
openalea.plottools.VS Plotandopenalea.plottools.tuples2seqon the workspaceConnect the
mapoutput the input oftuples2seqand the last output theVS Plotnode.Run the dataflow
Save it in the standbuilder package as plot_csv
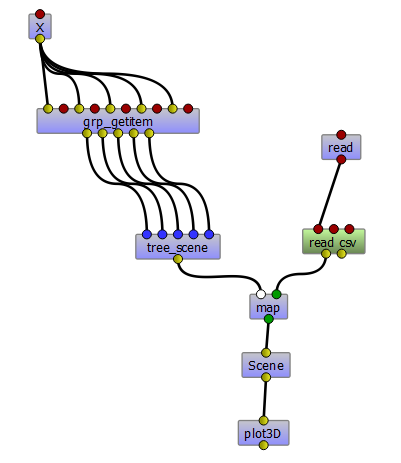
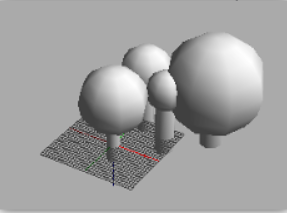
Step 6 : Apply the process to multiple trees#
In this step, we used the same method to build the entire stand
Open the
readcsv_3dataflowModify it in order to plot in 3D all the tree contained in the file and not only one
Use a
openalea.flow control.Xnode and aopenalea.functional.mapnodeSave this work in your standbuilder package as plot_stand