
VisuAlea Manual#
Visualea is a high level visual programming GUI for OpenAlea.
On Linux, run the following command in the conda environement
visualea
On Windows
visualea.exe
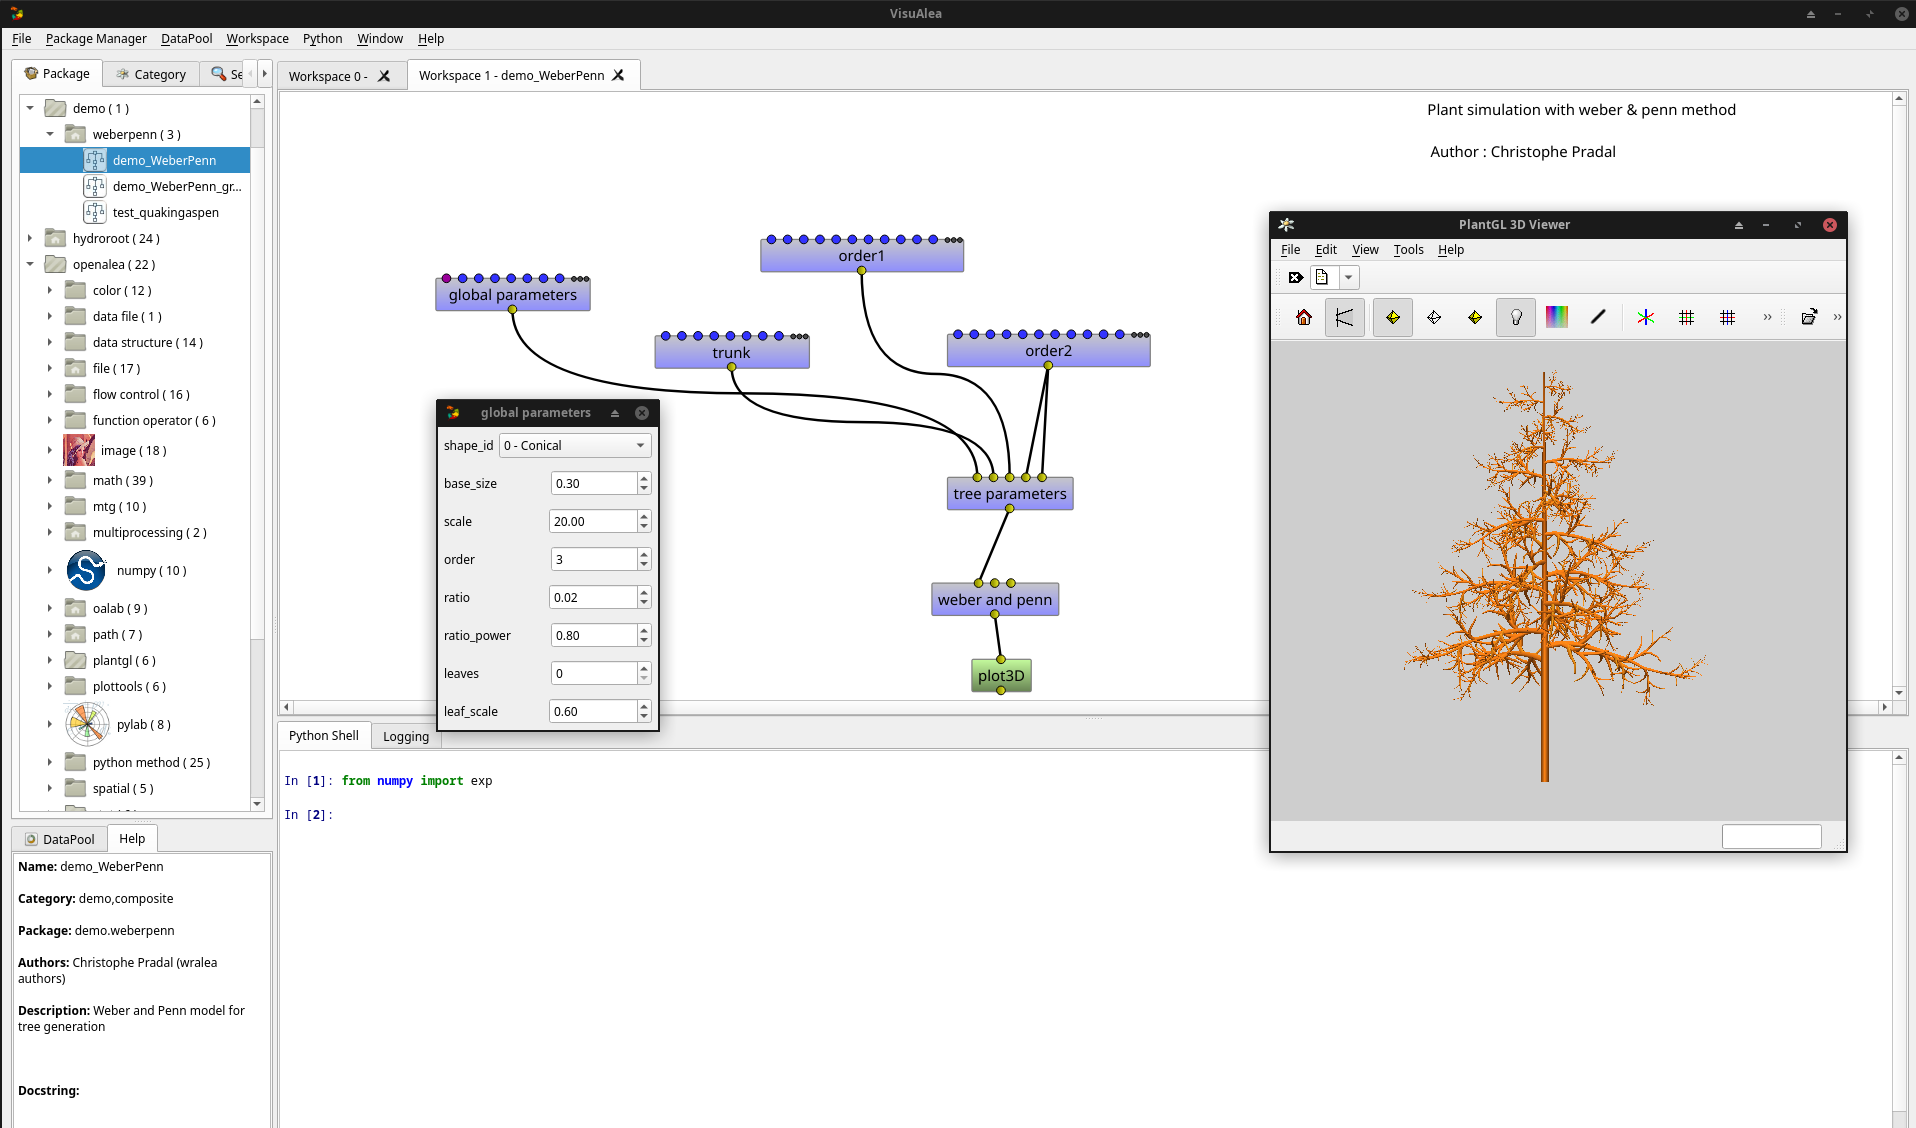
- The main window is composed of:
The package manager (lists nodes),
The workspaces where dataflows are graphically assembled,
Each node has it’s own graphical interface,
The python interpreter for low level interaction (with code completion)
Package Manager#
The package manager finds the available components on the system.
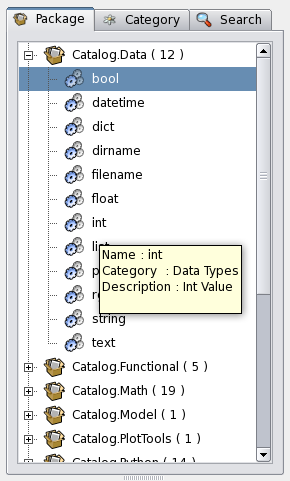
It provides different tabs:
The package tab lists packages and nodes in their physical hierarchy.
The category tab sorts nodes into logical categories to ease-up lookup.
The search tab: search node by matching pattern with node name, category and description.
Package / Node / Dataflow#
The package manager contains packages. A package is a distribution unit containing a set of components ( node / graphs). A package has several associated informations like:
Authors
Institutes
License
Description
URL
These package informations are accessible from the context menu:
Package Context Menu
Open Url: Open associated url
Infos: Display meta informations
Each package element has also a context menu:
Node (Component) Context Menu
Open: Open the node
Edit: Edit the node (Code Editor for Python node, Dataflow for Composite node)
Remove: Remove the node from the package
Note
Tooltip are available by moving the mouse pointer on an object.
Note
Double click on an object can either Open it or Edit it depending of its type.
User packages / system packages#
Opening workspaces#
You can create several workspaces:
Workspace → New empty workspace or CTRL + T
Double click on a graph in the package manager. In this case the workspace contains the graph.
Adding new nodes#
You can add nodes by drag and drop between the package manager and the workspace.
You can also do Copy/Paste operation directly in the workspace.
A node is represented by a box with input and outputs ports.
Inputs are on the top of the box
Outputs are on the bottom of the box
You can view the documentation of a node by letting the mouse pointer on the node.
Connecting nodes#
You can connect the nodes between them by doing a drag and drop operation between ports.
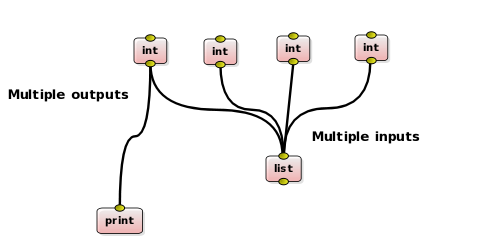
An output port can be connected to several different input ports: in this case the value will be copied to the different port
An input port can be connected to several different output ports: in this cas the value will be the list of the different value of the connected output ports.
Node Graphical interface#
Each node has a configuration dialog (its widget). You can open the widget with the context menu (right click → open widget) or by double clicking the node.
The widget depends of the node, it can be a simple value editor (spinbox for numbers, text editor…), or complex editor like 3D visualizer.
Running a dataflow#
The graph of nodes form an expression.
To evaluate the expression:
Menu → Workspace → Run will evaluate all the graph
Context Menu → Run on a particular node will evaluate only the selected node and its parents.
If you change a value of a node, the evaluation algorithm will compute only the changed nodes and their dependencies, avoiding to do several times the same computation.
Deprecated since version The: node contained in a graph can be in different states/ The color of a node depends of its state:
Red: the node need to be reevaluated
Blue: the node doesn’t need to be reevaluated
To change the status of a node or of a dataflow:
Context Menu → Reset: Reset the corresponding node
Workspace → Reset: Reset all the dataflow
Workspace → Invalidate: Force all nodes to be reevaluated the next time
You can visualize the value of a port: Context Menu → Print and with tooltips.
Save a dataflow / Composite Node#
A Composite node is an abstraction of a dataflow graph. It is a node which contains other nodes.
Composite nodes are used to:
save a dataflow
manage complexity
Saving a dataflow#
To save a dataflow:
Save the workspace as a composite node: Workspace → Save as composite node or CTRL + E
This function will save the graph but also the value of the node inputs
Managing complexity#
A composite node can be reused as a normal node (a simple box). You can embed a part of a graph in a composite node:
Select the node you want to group/embed
Workspace → Group or CTRL +G
This will create a new node containing all selected nodes.
This function can be used to improve the readability of your graph and facilitate reuse of complex functionalities.
I/O#
As normal node, a composite node has inputs and outputs. They can be set:
Workspace → configure I/O
Each input has:
a name
an interface (used for the graphical interface and for type checking)
a default value
Each output has:
a name
an interface (used for type checking)
Open/Save a session#
You can save the entire session in order to keep all the data you currently use.
File → save session: Save the current session for a furur reuse
File → open session: Open a previously saved session
File → new session: reinitialize all the workspace
Warning
This functionality is not safe and we do NOT recommand to use it. Use export as composite node instead to save your work
Export Application#
A graph can be exported as a standalone application (a python module): Workspace → Export to Application.
The application can be previewed with the command: Workspace → Preview Application.
Data Pool#
The data pool is a kind of data clipboard to store temporally computed data.
You can send data to the Pool: Port Context menu → Send to pool
You can re-use data of the pool in the dataflow by doing a drag and drop from the datapool list to aaninput port.
You can also access to the datapool in the interpreter (drag and drop to the interpreter will copy the correct code):
>>> datapool['name'] = object # set a data instance
>>> print datapool['name']    # get a data instance
Python Operations#
At any moment, you can use the python interpreter to launch python command or scripts.
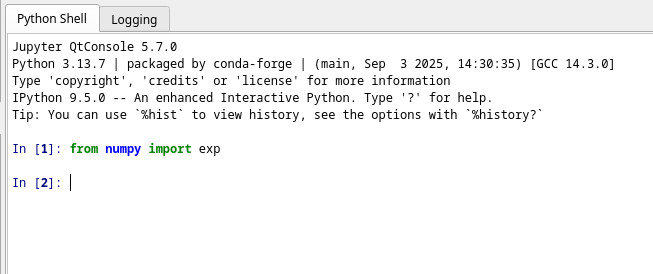
The interpreter defines special variables:
session contains the different workspaces and the nodes they contain
datapool is the datapool dictionary
pmanager is the package manager
By doing a drag&drop of node with the mouse mid button, you will be able to access to the data of a node.
You can also do a drag and drop from the datapool.
Preferences#
Interface preferences can be set via the preference dialog: Window → Preferences